


This guide will serve as a comprehensive resource for anyone interested in data visualization. Leveraging the capabilities of ChatGPT, we will show you how to turn raw data into compelling, animated graphs. Whether you're a seasoned data scientist or just starting on your data journey, this step-by-step guide will provide valuable insight into the process of creating dynamic and interactive visuals. You'll learn how to employ ChatGPT's code interpreter to efficiently and effectively transform your data, making your presentations and reports more engaging and insightful. So, let's dive into the world of data visualization with ChatGPT!
Now let's learn how to use Code Interpreter in ChatGPT to create animated graphs for the given data:
Step 1: Go to https://chat.openai.com/
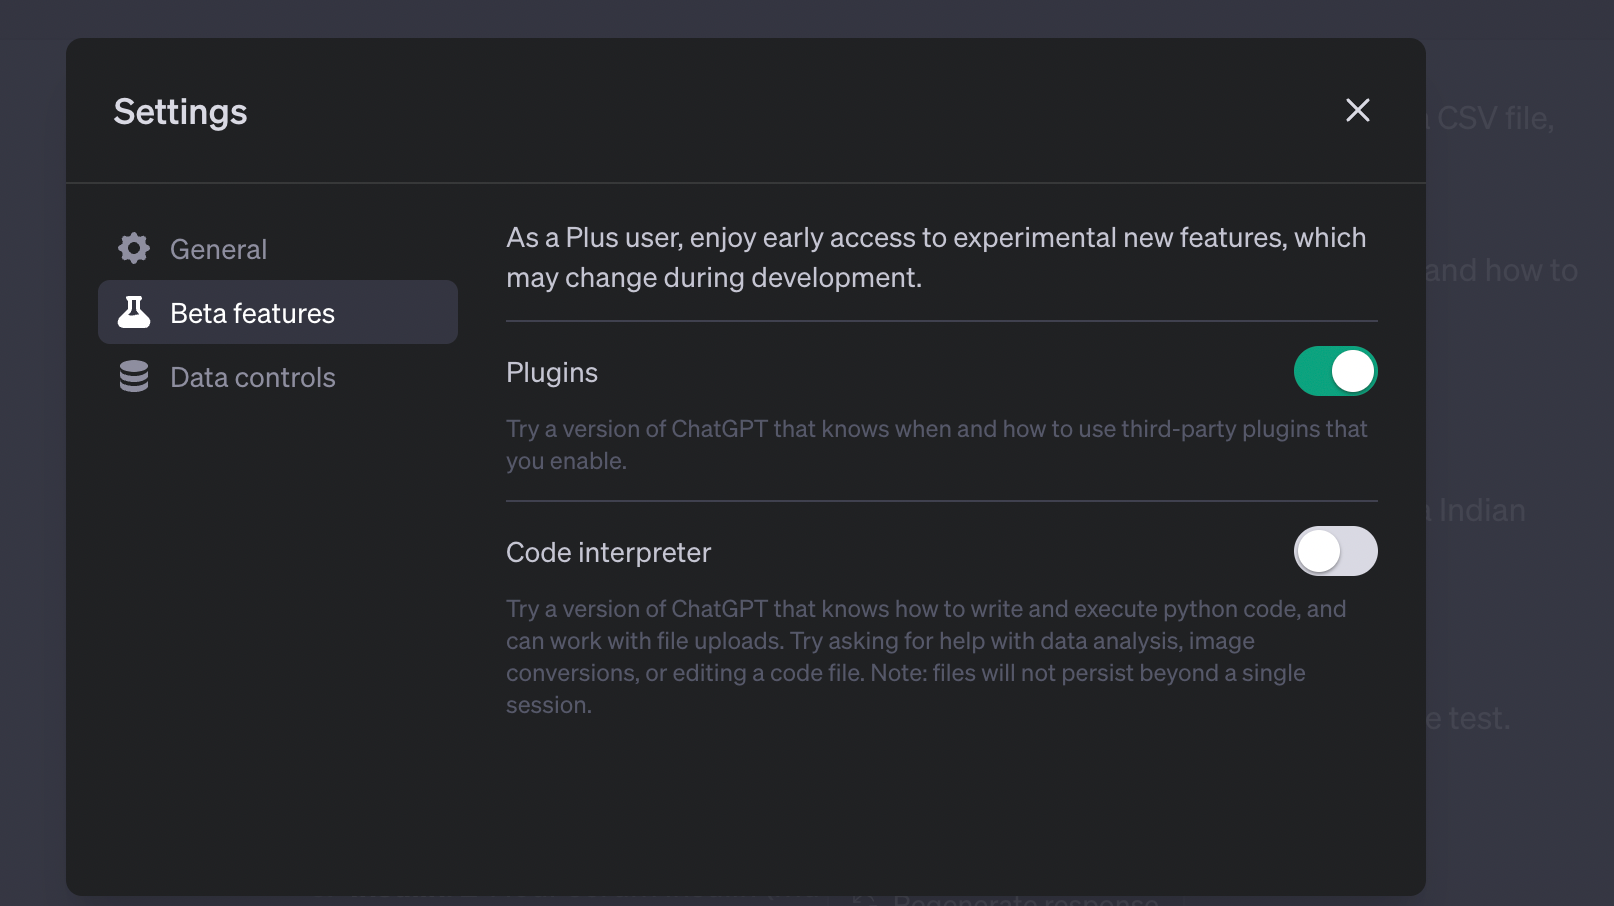
Step 2: Go to 'Settings' and 'Beta features' to activate 'Code Interpreter.' You may need to have a ChatGPT Plus account.
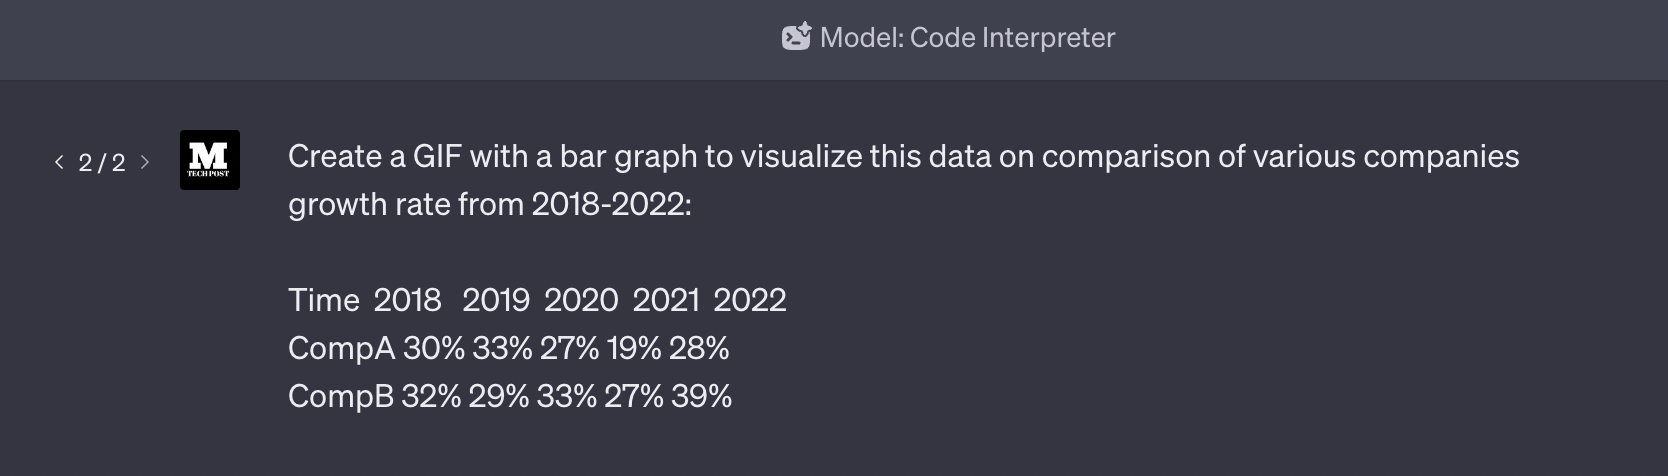
Step 3: Add this prompt:
"Create a GIF with a bar graph to visualize this data on [your topic]: [Paste your data]"
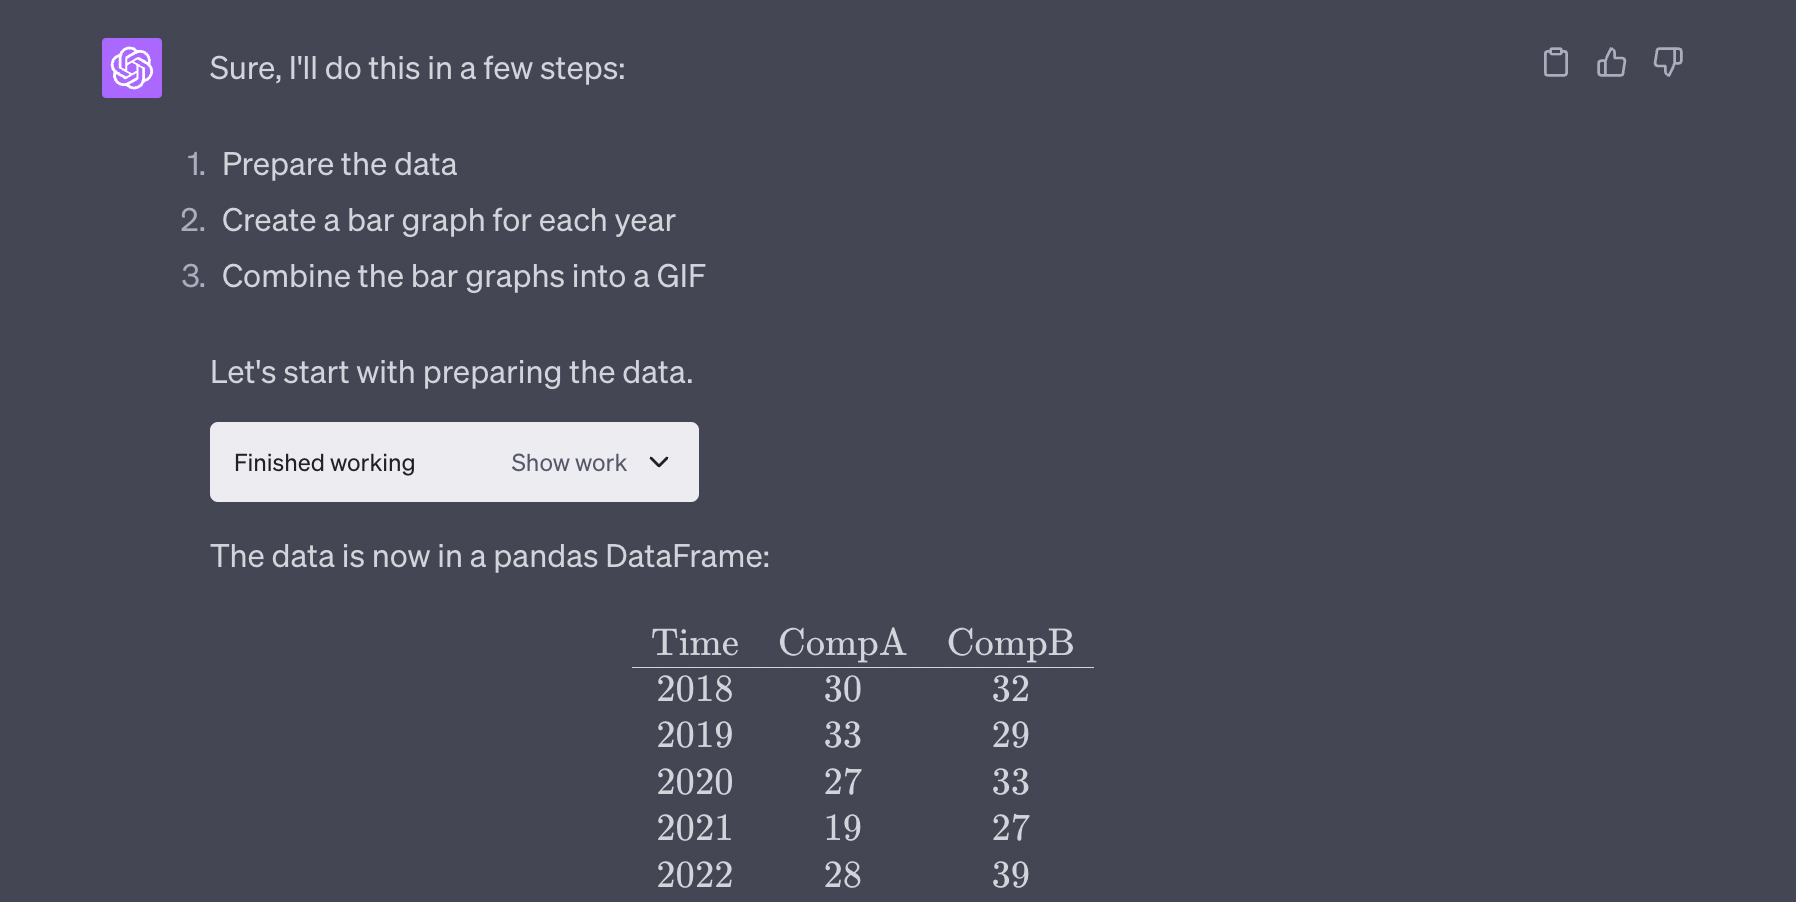
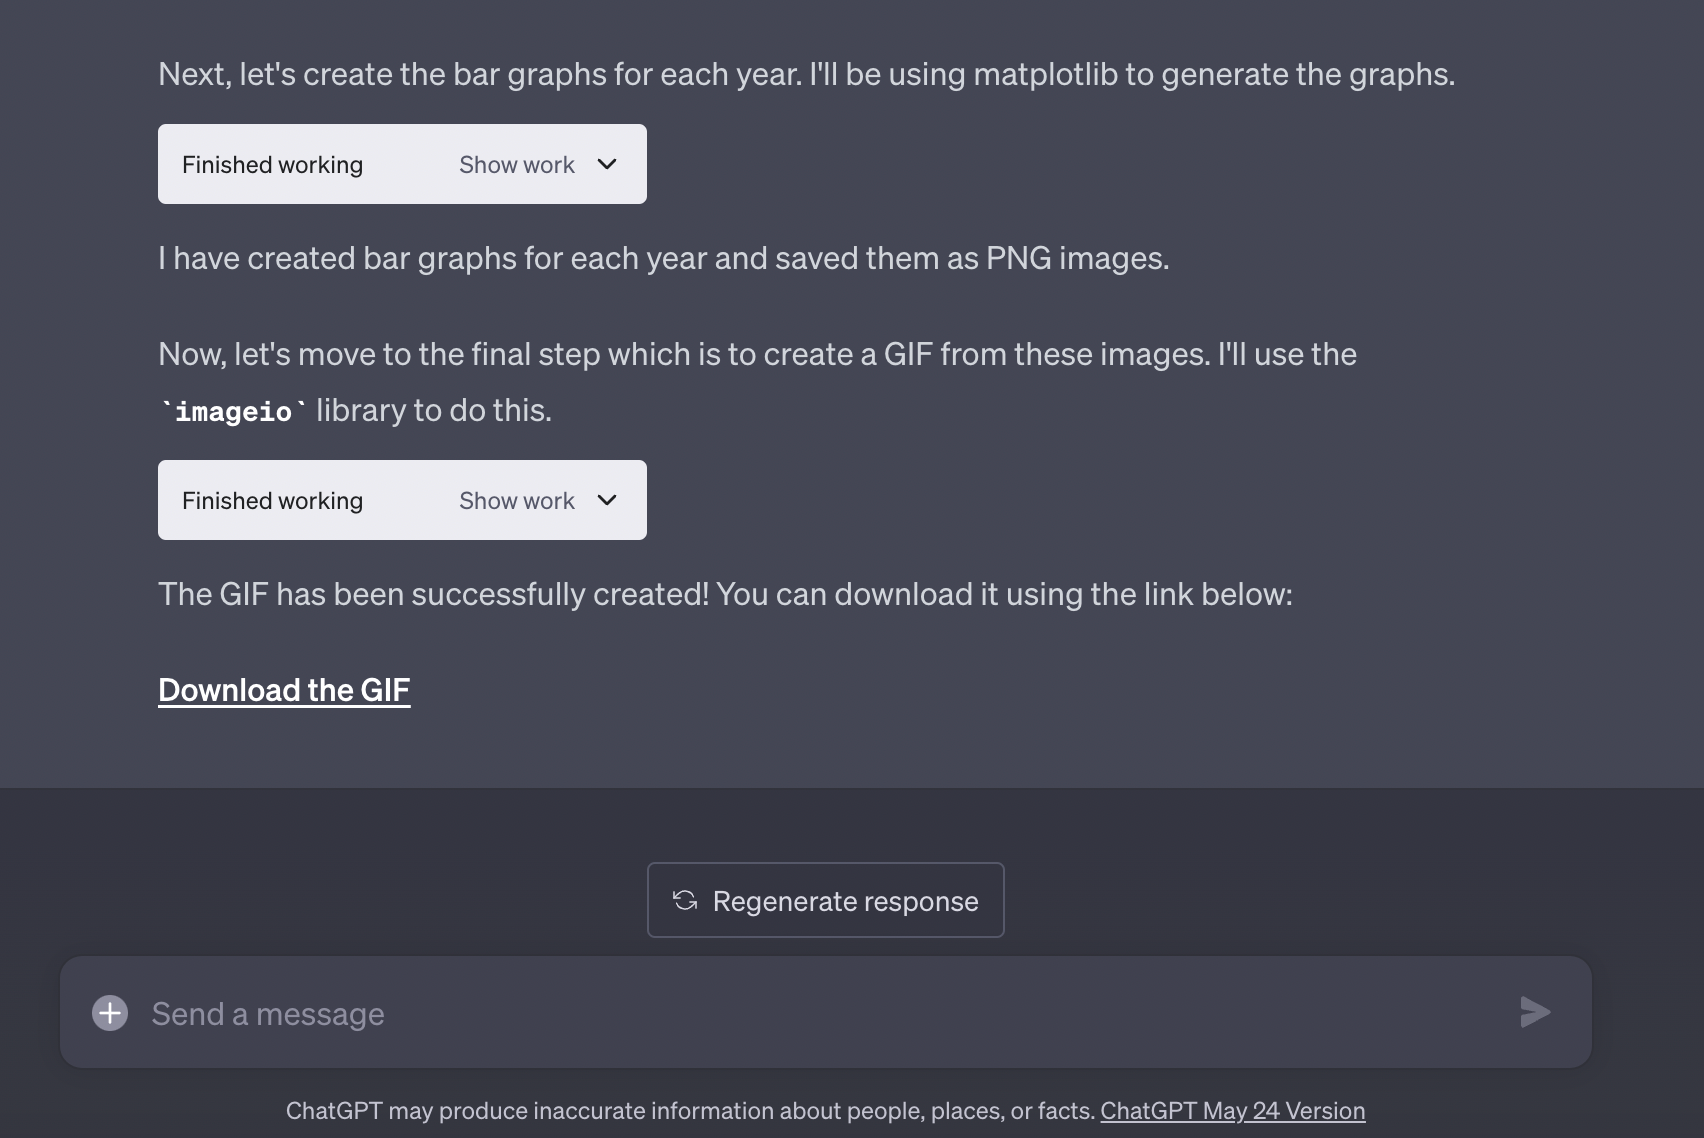
Step 4: Follow the screen and click on the 'Download link' once it's ready.
Don’t forget to join our AI Tools SubReddit, Twitter, and Facebook Group, where we share cool AI projects and more. If you have any questions regarding the above article or if we missed anything, feel free to email us at Asif@marktechpost.com

